Assay resolution governs the transfer of molecular dependence
Abstract
Background. Separate molecular assays retain coexpression even when cross-assay cell pairing is unavailable. We ask which recipient measurements are needed to transfer RNA–protein dependence from a paired reference.
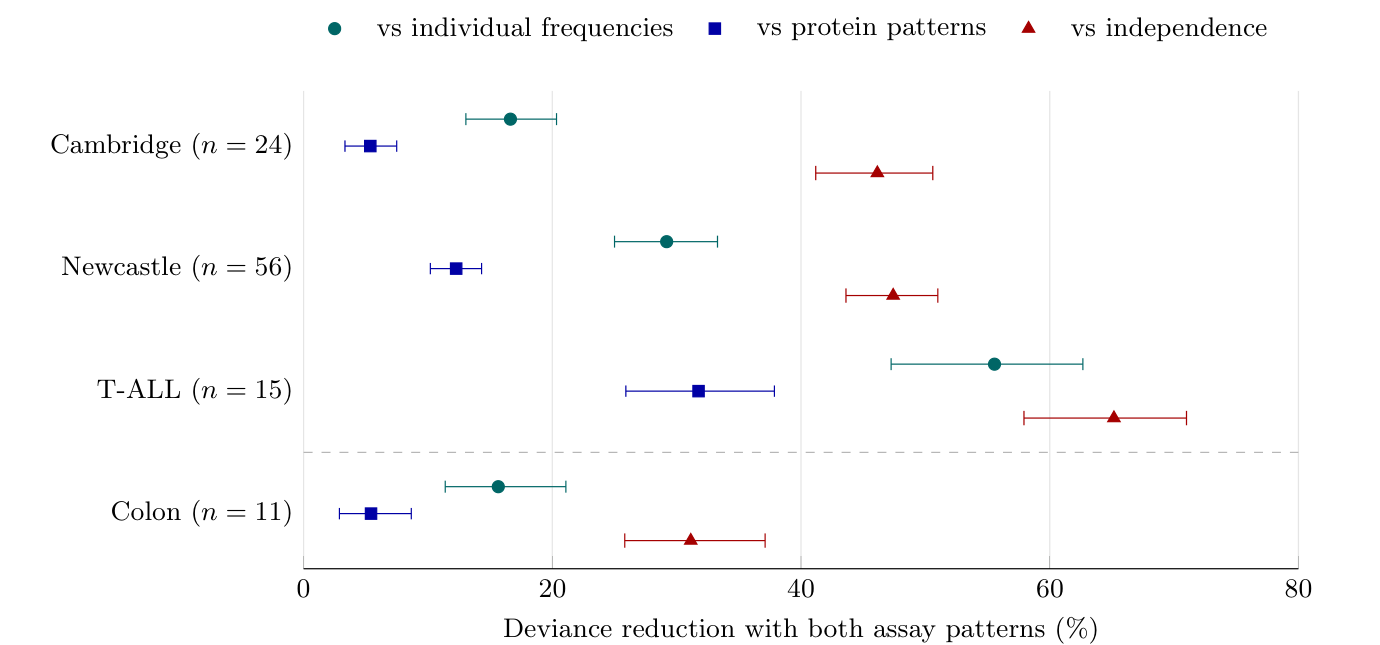
Results. For finite assay profiles and a fixed interaction, we derive the sharp range of binary associations compatible with specified unpaired summaries and its minimax predictor. Retrospective reconstruction in 24 Cambridge donors, 56 Newcastle donors, and 15 patients with pediatric T-cell acute lymphoblastic leukemia (T-ALL) reduced deviance by 16.6%, 29.2%, and 55.6% when both assay-pattern distributions replaced individual frequencies (paired recipient-bootstrap 95% intervals, 13.0–20.3%, 25.0–33.3%, and 47.2–62.7%). Recipient preprocessing and marginal estimates used 256 adaptation cells; 256 untouched cells supplied the endpoint. In an independent test specified publicly before count access, the unchanged blood-reference model reduced deviance by 15.7% in 11 colon-biopsy donors (11.4–21.1%), improving every donor. Both patterns also improved on protein patterns alone and independence after adjustment for the three prespecified comparisons. In a separate fixed-frequency comparison, covariances retained 91–97% of the pattern-level gain and recipient-specific structure outperformed larger matched pools. A covariance response formula improved query prioritization over direct interaction strength in Newcastle and leukemia.
Conclusions. Assay summaries determine both the identifiable range of molecular dependence and the information available for its prediction. Preserving recipient coexpression improves held-cell prediction without supplying scoring-cell frequencies or cross-assay pairings.
Background
Joint single-cell assays reveal how molecular measurements covary within cells. When a new cohort supplies the assays separately, a paired reference can support prediction of the missing joint distribution. The recipient still provides two kinds of information: the frequency of each molecular state and the patterns of states observed together within each assay. These are different constraints on the cross-assay prediction.
We derive the complete range of a binary association under arbitrary within-assay moment constraints and a fixed fine interaction. This range applies to the full set of marker frequencies supplied in our benchmark; a closed form is available when only the two queried frequencies are retained. The range gives an attainable worst-case prediction and an error floor that additional observations at the same resolution cannot remove. We then measure the value of within-assay structure while holding the interaction, cells, and recipient marker frequencies fixed. This comparison separates the information retained by each representation from differences between fitted estimators.
A sharp limit at the observed resolution
Let the observed RNA and protein summaries be arbitrary finite collections of within-assay means. They define convex polytopes of complete assay distributions consistent with those summaries. For each pair of assay distributions, matrix scaling gives the unique joint distribution with interaction S and those assay marginals.
The set of compatible binary query tables is an interval whose endpoints are obtained by minimizing and maximizing the queried joint probability over these polytopes, allowing zero-mass assay states. It is the sharp identified set when all individual marker frequencies are supplied. Complete assay-profile histograms collapse both polytopes to points. These are the constraints used by the means-only and full-pattern reconstructions.
The means-only exponential-family fit selects one member of this set by information projection. The interval records what the supplied frequencies identify without that additional selection. The unique minimax table equalizes the forward Kullback–Leibler loss from the two endpoint tables.
Individual frequencies can all agree
The ambiguity also occurs when every marker's individual frequency is known. Consider two binary RNA markers and one protein marker, coded as Z1, Z2, W ∈ {−1, 1}, each with mean zero. Fix the fine interaction to S = JZ2W, with J ≠ 0. Let the recipient RNA distribution have correlation ρ = E(Z1Z2). Reconstruction gives
Changing ρ from negative to positive reverses the queried RNA–protein association without changing J or any individual marker frequency. Separate RNA profiles reveal ρ; their individual frequencies do not. As ρ ranges over its compatible values, the all-marker interval for Pr(Z1 = 1, W = 1) is [(1 − |tanh J|)/4, (1 + |tanh J|)/4].
How coexpression changes the prediction
For fixed positive assay distributions on finite supports, scale a bilinear interaction as St(x, y) = t x⊤B y, where B is the source interaction matrix and t sets its strength. Let Σx and Σy be the two within-assay covariance matrices. Near independence, the reconstructed cross-assay covariance satisfies
To first order, each predicted RNA–protein covariance sums source interactions weighted by recipient covariances in both assays. A source coefficient therefore need not equal the marginal association observed in a new population.
This local formula is the initial value of an exact finite-strength identity. If st is the score along the fixed-marginal reconstruction, the marginal constraints remove its conditional means and give
The response also predicts which queries are sensitive to replacing recipient coexpression by pooled structure. For a binary query with nonconstant marker frequencies, subtract the queried entries of ΣxBΣy for the recipient and pool, square the difference, and divide by the product of the two marker variances. This is the leading coefficient of twice the KL divergence between their query distributions near independence (Additional file 1). We test whether this score identifies relationships whose empirical prediction improves with recipient-specific reconstruction.
Assay patterns improve prediction on untouched cells
Both assay-pattern distributions improved adaptation-only prediction in all three cohorts. Mean deviance fell from 0.02229 to 0.01858 in Cambridge, from 0.03233 to 0.02289 in Newcastle, and from 0.05847 to 0.02599 in T-ALL. These are reductions of 16.63% (95% interval, 13.05–20.34%), 29.19% (25.00–33.28%), and 55.56% (47.25–62.67%). Full patterns improved 24/24, 55/56, and 15/15 people, respectively.
Retaining RNA patterns in addition to protein patterns reduced loss by 5.36% (95% interval, 3.33–7.49%), 12.27% (10.19–14.31%), and 31.76% (25.91–37.86%). Reductions relative to independence were 46.14%, 47.41%, and 65.16%. All nine multiplicity-adjusted intervals had positive lower endpoints. The pattern-level advantage persisted when recipient preprocessing and marginal estimates used adaptation cells alone, including the uncertainty those estimates introduce into held-cell prediction.
The blood-reference model transfers to colon biopsies
Full assay patterns reduced mean deviance from 0.02588 to 0.02183 in the 11 independent colon donors, a reduction of 15.65% (95% interval, 11.39–21.09%). Every donor improved relative to individual frequencies. Loss fell by 5.42% relative to protein patterns alone (2.88–8.66%; 10/11 donors) and by 31.13% relative to independence (25.83–37.11%; 11/11 donors). The three adjusted lower bounds were 10.89%, 2.56%, and 24.85%, respectively, meeting the prespecified criterion.
This transfer used recipient measurements made separately within each assay without changing the interaction learned in blood. Additional file 1 reports all five arms and the descriptive clinical-group summaries.
Recipient covariances recover most of the pattern-level gain
To isolate dependence prediction from errors in estimated marker frequencies, we also analyzed the same recipients conditional on their scoring-cell frequencies. This analysis used the original donor-wide protein states and source fit. Its losses are reported separately because its states and permitted information differ from adaptation-only prediction.
The covariance-preserving replacement retained 91.36% (paired-bootstrap 95% interval, 89.09–94.03%), 97.36% (96.28–98.38%), and 95.68% (93.42–97.25%) of the loss reduction from individual frequencies to full patterns in Cambridge, Newcastle, and T-ALL, respectively. Full patterns improved further by 4.74% (95% interval, 2.81–6.78%), 2.27% (1.25–3.37%), and 10.35% (7.59–13.74%), improving 22/24, 44/56, and 15/15 people.
Recipient-specific covariance also improved on both pooled controls. Against the source pool, deviance fell by 9.80%, 28.13%, and 60.57% in Cambridge, Newcastle, and T-ALL. Against other recipients in the same cohort, the reductions were 9.15% (95% interval, 2.29–15.57%), 17.94% (12.58–23.00%), and 45.97% (35.24–55.79%), with improvements in 15/24, 42/56, and 14/15 people.
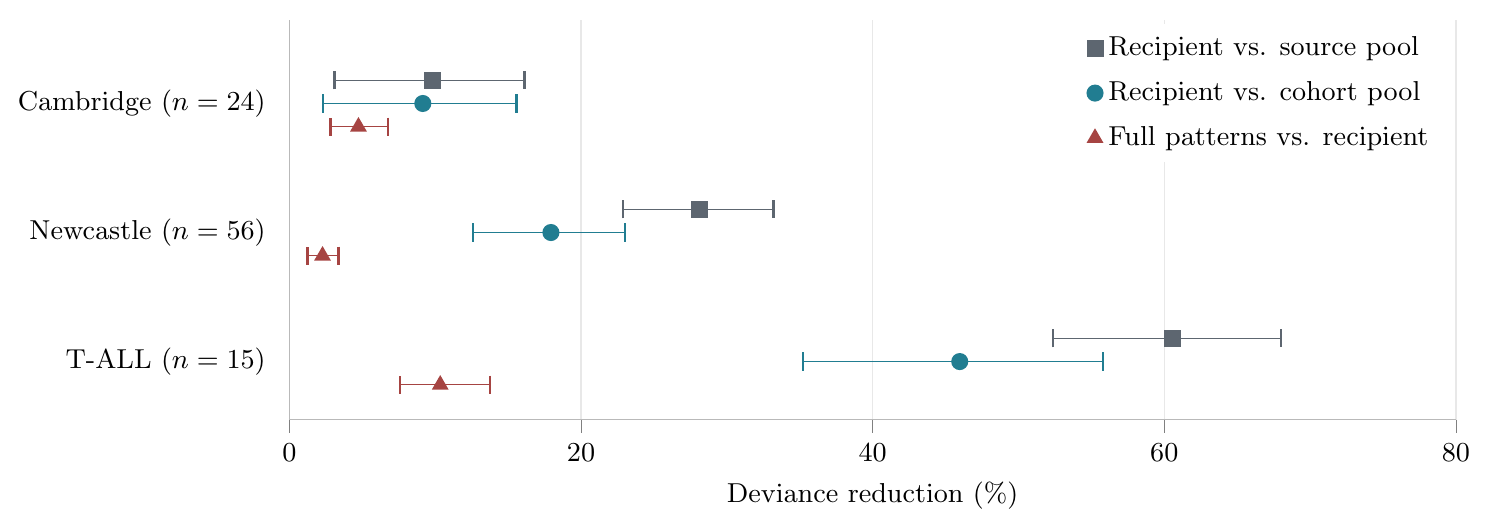
Each recipient supplied 256 adaptation cells per assay, compared with 3,072 source cells or 3,584–14,080 cells in the cohort pool. Matching individual frequencies and using more cells from other people did not recover the recipient-specific gain.
Coexpression prioritizes recipient-specific corrections
The response score concentrated the recipient-specific gain into relatively few relationships. Its top third accounted for 87.0%, 90.1%, and 85.5% of the net deviance reduction in Cambridge, Newcastle, and T-ALL, compared with 85.0%, 60.9%, and 38.5% under direct source-interaction ranking.
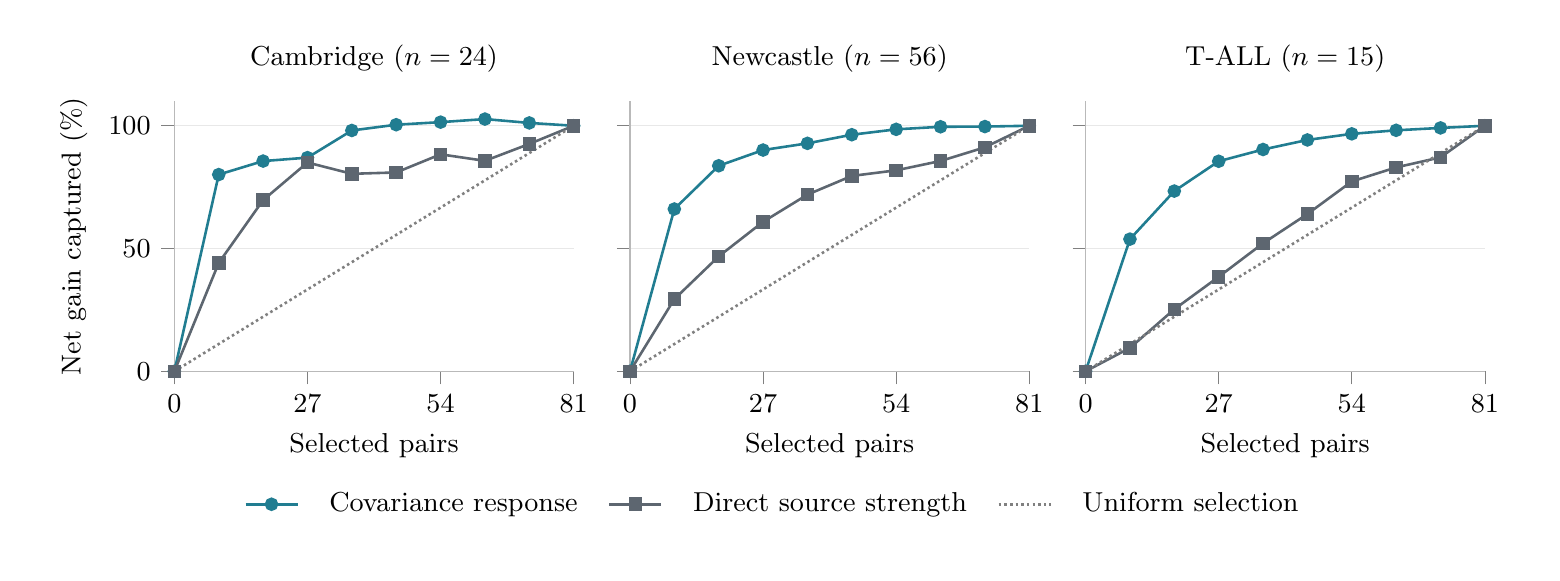
In Newcastle, the mean gain per selected pair was 0.00506 under the response score and 0.00342 under direct ranking; the paired difference was 0.00164 (95% interval, 0.00085–0.00256). In T-ALL the gains were 0.02523 and 0.01135, a difference of 0.01388 (0.00906–0.01925). Both contrasts survived the six-comparison adjustment. Cambridge gave similar gains under the two rankings, 0.00168 and 0.00164 (difference, 0.00004; −0.00077 to 0.00085).
In T-ALL, the three highest cohort-mean scores were for CD7 RNA–CD4 protein, CD4 RNA–CD52 protein, and CD7 RNA–CD52 protein; their mean deviance gains were 0.04513, 0.01245, and 0.04981. The original study used CD4 and CD7 to distinguish T-cell populations and included CD52 in a leukemia expression signature. These corrections concern marker combinations associated with the cohort's cellular heterogeneity.
The response ranking persists at fitted strength
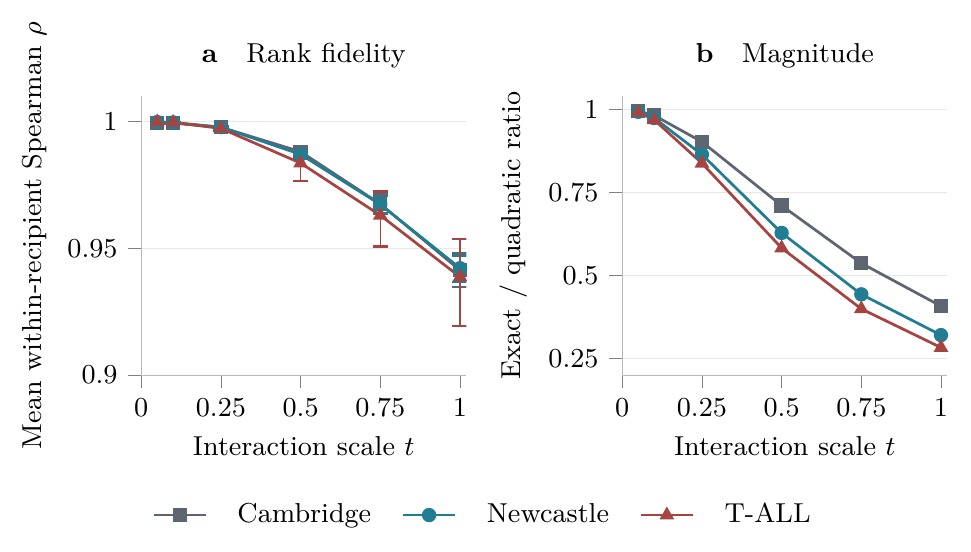
The response coefficient remained closely aligned with exact model discrepancy as the interaction increased from independence to its fitted strength. At t = 1, mean within-recipient Spearman correlations were 0.941 in Cambridge (95% interval, 0.935–0.948), 0.942 in Newcastle (0.937–0.947), and 0.939 in T-ALL (0.919–0.954). The response and exact rankings shared 90.3%, 89.5%, and 89.1% of their top 27 queries. The cohort-aggregate exact discrepancy was 40.8%, 32.1%, and 28.3% of the quadratic approximation.
Discussion
The resolution at which a relationship is reported need not be the resolution at which it should be transferred. A binary RNA–protein table depends on the distribution of finer cellular profiles. Reconstructing those profiles before aggregation allowed one source interaction to predict different recipient associations using measurements made separately within each assay.
The pooled controls distinguish recipient-specific coexpression from generic population structure: more observations from other people did not replace the recipient's own assay patterns.
Limitations
The blood and leukemia analyses reuse previously examined recipients from two studies. The colon analysis was specified before count access, but uses one existing study and eleven donors; it is not a prospective specimen collection. Its clinical groups are too small to establish disease- or treatment-specific effects. The adaptation-only test changes the protein-state definition as well as the information boundary; its effect sizes cannot be subtracted from the conditional results to measure information leakage. Intervals condition on the source fit and fitted pools, omitting their estimation uncertainty, dependence between overlapping cohort pools, and the adaptive research history.
The panel contains nine RNA and nine protein markers. The conditional analysis uses donor-wide protein ranks and individual scoring-cell marker frequencies; the adaptation-only analysis uses neither. Two Stephenson recipients have almost no counts across the protein panel and were retained. The task is fixed-margin dependence prediction from separately measured assays, not missing-modality imputation without target assay observations. The results do not isolate within-cell-type regulation or establish molecular binding, causal effects, or clinical utility.
The identified interval assumes a known transferable interaction, finite assay supports, and exact recipient summaries. Its all-marker endpoints require global optimization over the corresponding marginal polytopes; only the two-frequency case has the closed form reported here. The examples establish ambiguity, not its biological magnitude. Query-wise minimax predictions need not form a coherent multivariate law. Interaction drift, sampling error, and coarsening ambiguity remain distinct.
We tested one maximum-entropy replacement, which preserves fitted means and covariances but can induce higher-order correlations. The retained gain is descriptive, not causal mediation. The exact response identity holds at finite strength, but the query score is its local coefficient; at t = 1, the quadratic approximation exceeded the exact model discrepancy. The score predicts model discrepancy, not error against an arbitrary biological population. The query-ranking advantage over direct source strength was unresolved in Cambridge. Prioritization requires the full measured panel and does not establish savings from measuring fewer markers. Sorting and cell mixtures can contribute to the observed coexpression.
Reconstruction, noncollapsibility, and minimax KL prediction have established foundations. The theory concerns the resolution-dependent identified set; the experiments establish an information advantage, not a superior cost learner. The CHAMPOLLION comparator uses its no-prior objective with a common recipient adapter, not its complete published workflow.
Conclusions
Within-assay cellular patterns improved RNA–protein prediction across cohorts and in an independent blood-to-colon test with the source interaction held fixed, including prediction on untouched cells without supplying their marginal summaries. In the conditional analysis, recipient-specific covariances retained most of the pattern-level gain and outperformed source and cohort pools matched to the same marker frequencies. Full patterns improved further in each cohort. Separately measured recipient coexpression can therefore support molecular predictions that individual frequencies and cohort averages do not recover.
Availability of data and materials
Source data are available under E-MTAB-10026 (Stephenson CITE-seq), GSE248287 (T-ALL), and GSE250490 (colon biopsies). The colon analysis uses the public count matrix in Figshare article 21919356, version 3; its frozen protocol and complete results are released separately. The original benchmark's analysis plans, software, and study records are available in the v2.0.4 release. The accompanying analysis artifact contains derived assay distributions, reconstruction code, predictions, and recipient-level losses for the subsequent resolution analyses, together with executable checks of the reported comparisons. Additional file 1 specifies the protocols. Raw matrices are not redistributed.